Part of KUdos Custom Electronics Stack
KUdos Robot Manager
An Electron desktop app for managing VEX-U robots with SSH deployment, Limelight tunneling, and live terminal access.
Project Overview
KUdos Robot Manager is a desktop application I built to streamline robot management for the KUdos VEX-U team. The app replaces manual SSH and SCP commands with a visual interface for deploying code, forwarding Limelight ports, and managing robot services.
The team runs two robots (Blue and Gold) with identical configurations. The app automatically detects which robot is connected based on the WiFi network and adjusts its interface accordingly.
Role: Solo developer, including Electron setup, SSH integration, and terminal emulation.
Tech Stack: Electron, Node.js, node-pty, xterm.js
Features
- Auto Robot Detection: Identifies connected robot by WiFi SSID
- SSH Status: Visual indicator of connection health
- Limelight Tunneling: One-click port forwarding for vision camera access
- Code Deployment: Full build pipeline with rsync, compilation, and service restart
- Live Terminal: Embedded SSH terminal with full color and tab completion
- Service Management: Start, stop, restart, and view logs for robot services
Robot Configuration
| Robot | WiFi Network | Purpose |
|---|---|---|
| Blue | KudosBlue | Primary competition robot |
| Gold | KudosGold | Practice/backup robot |
Both robots use Raspberry Pi coprocessors with identical software stacks. The app determines which robot is connected based on the current WiFi network.
Deployment Pipeline
The deployment pipeline is a multi-stage process that handles everything from file synchronization to service management:
- Time Synchronization — Sets the Pi's system clock to match the host machine (important since the Pi has no RTC)
- File Transfer — Uses rsync to sync source files to
/home/kudos/coprocessor/on the Pi - Remote Build — Executes
makeon the Pi to compile the C++ firmware - Service Restart — Restarts the
kudos-coprocessor.servicesystemd unit
The pipeline provides real-time status updates through the UI, showing each stage's progress. If any stage fails, the process halts and displays the error output.
// Deployment stages executed sequentially
const stages = [
  { name: 'time-sync', label: 'Syncing time...' },
  { name: 'rsync', label: 'Transferring files...' },
  { name: 'build', label: 'Building on Pi...' },
  { name: 'restart', label: 'Restarting service...' }
];
Technical Implementation
Electron Architecture
The app uses Electron's secure context isolation pattern:
- Main process (
main.js): Handles SSH connections, file transfers, port forwarding, and spawns child processes - Preload (
preload.js): Exposes a safe API bridge usingcontextBridge.exposeInMainWorld - Renderer (
index.html): UI with vanilla HTML/CSS/JS that communicates through the exposed API
// Preload exposes a safe API to the renderer
contextBridge.exposeInMainWorld('api', {
  detectRobot: () => ipcRenderer.invoke('detect-robot'),
  checkSSH: (opts) => ipcRenderer.invoke('check-ssh', opts),
  pushCode: (opts) => ipcRenderer.invoke('push-code', opts),
  startLimelight: (opts) => ipcRenderer.invoke('start-limelight', opts),
  // ... terminal, telemetry, service management
});
Robot Auto-Detection
The app automatically identifies which robot is connected by reading the current WiFi SSID. Since macOS can redact the SSID for privacy, the app tries multiple detection methods:
system_profiler SPAirPortDataType(most reliable)networksetup -getairportnetwork en0(fast)wdutil info(bypasses some restrictions)- Legacy
airportcommand
If all methods return "redacted", the app falls back to manual robot selection.
Limelight Port Forwarding
The Limelight camera runs a web interface on ports 5800-5805. Since the camera is on the robot's internal network (172.29.1.x), accessing it from a laptop requires SSH port forwarding through the Pi:
const ports = [5800, 5801, 5802, 5803, 5804, 5805];
const portArgs = ports.flatMap(p => ['-L', `${p}:${limelightIp}:${p}`]);

limelightTunnel = spawn('ssh', [
  '-N',  // No command, just tunnel
  '-o', 'ServerAliveInterval=30',
  ...portArgs,
  `${user}@${host}`
]);
Once the tunnel is active, the Limelight interface is accessible at http://localhost:5800.
Terminal Emulation
The embedded terminal uses node-pty for a real PTY (pseudo-terminal) connected to SSH, giving full terminal capabilities:
- Color output and ANSI escape codes
- Tab completion
- Interactive programs (vim, htop)
- Terminal resize events
const pty = require('node-pty');

ptyProcess = pty.spawn('ssh', ['-t', `${user}@${host}`], {
  name: 'xterm-256color',
  cols: 80,
  rows: 24,
  env: process.env
});

ptyProcess.onData((data) => {
  mainWindow.webContents.send('terminal-data', data);
});
The frontend uses xterm.js to render the terminal output with proper styling.
Telemetry Streaming
The coprocessor writes telemetry data to JSONL (JSON Lines) log files. The app streams this data in real-time by tailing the log file over SSH:
telemetryStream = spawn('ssh', [
  '-o', 'StrictHostKeyChecking=no',
  '-o', 'ServerAliveInterval=10',
  `${user}@${host}`,
  `tail -n 0 -f /home/kudos/logs/latest.jsonl`
]);

// Parse each line as JSON and send to renderer
buffer += chunk.toString();
const lines = buffer.split('\n');
buffer = lines.pop(); // Keep incomplete line in buffer

for (const line of lines) {
  if (line.trim()) {
    const data = JSON.parse(line);
    mainWindow.webContents.send('telemetry-data', data);
  }
}
The telemetry includes:
- Position data: X, Y coordinates and heading from odometry
- Sensor readings: IMU calibration status, encoder counts
- Limelight data: Target visibility, horizontal/vertical offsets, target area
The UI displays this data as live-updating graphs and numeric readouts, useful for debugging autonomous routines and verifying sensor calibration.
Service Log Viewer
The app can stream systemd journal logs from the coprocessor service:
serviceLogStream = spawn('ssh', [
  '-o', 'StrictHostKeyChecking=no',
  `${user}@${host}`,
  `sudo journalctl -u kudosrpi -n 50 -f`
]);
This shows the coprocessor's stdout/stderr output in real-time, including:
- Startup configuration messages
- Position/heading status updates
- Error messages and warnings
- Communication events with the VEX brain
Service Management
The app provides controls to manage the systemd service:
| Action | Command |
|---|---|
| Check Status | systemctl is-active kudosrpi |
| Restart | sudo systemctl restart kudosrpi |
| Stop | sudo systemctl stop kudosrpi |
These are exposed through the UI as simple buttons, with status indicators showing whether the service is running.
Log Replay
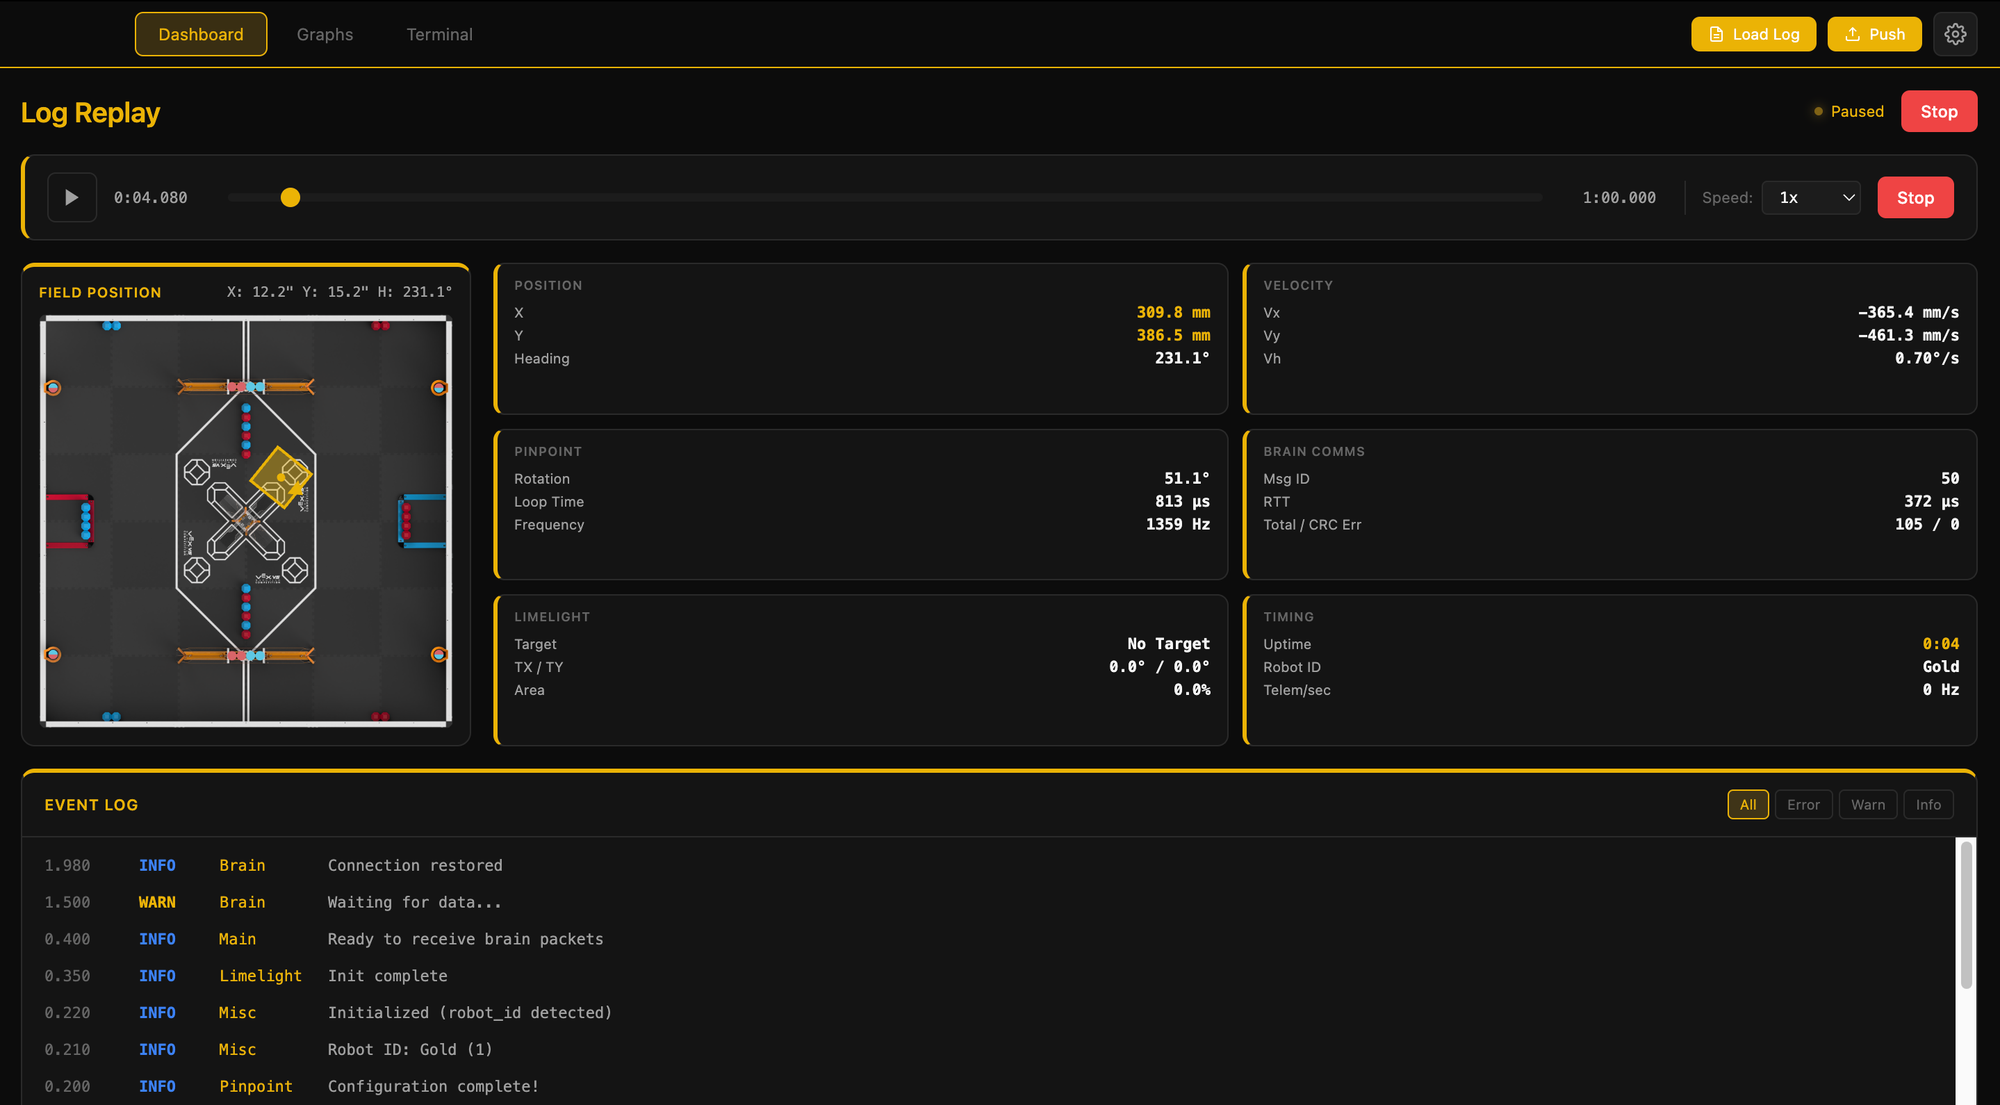
For debugging, the app can replay previously recorded telemetry logs. This is useful for analyzing what happened during a match:
// Load and parse JSONL file
const fileStream = fs.createReadStream(filePath);
const rl = readline.createInterface({ input: fileStream });

rl.on('line', (line) => {
  const data = JSON.parse(line);
  lines.push(data);
});

// Send to renderer for playback
mainWindow.webContents.send('log-replay-data', { lines, speed });
The replay can be sped up or slowed down, and the position data is visualized on a field map to show the robot's path during the recorded session.
The Problem It Solves
Before this app, managing the robot coprocessors required:
- Manually SSHing into the Pi
- Running rsync commands to copy code
- Running make to compile
- Running systemctl commands to restart the service
- Opening a separate terminal for logs
- Using SSH port forwarding for Limelight access
Each of these steps had to be repeated for every code change, and it was easy to forget a step or make typos. The app consolidates everything into a single interface where deploying new code is one button click.
Tech Stack
| Area | Tools |
|---|---|
| Framework | Electron |
| Terminal | node-pty, xterm.js |
| File Transfer | rsync, SCP |
| UI | Vanilla HTML/CSS/JS |
More in KUdos Custom Electronics Stack
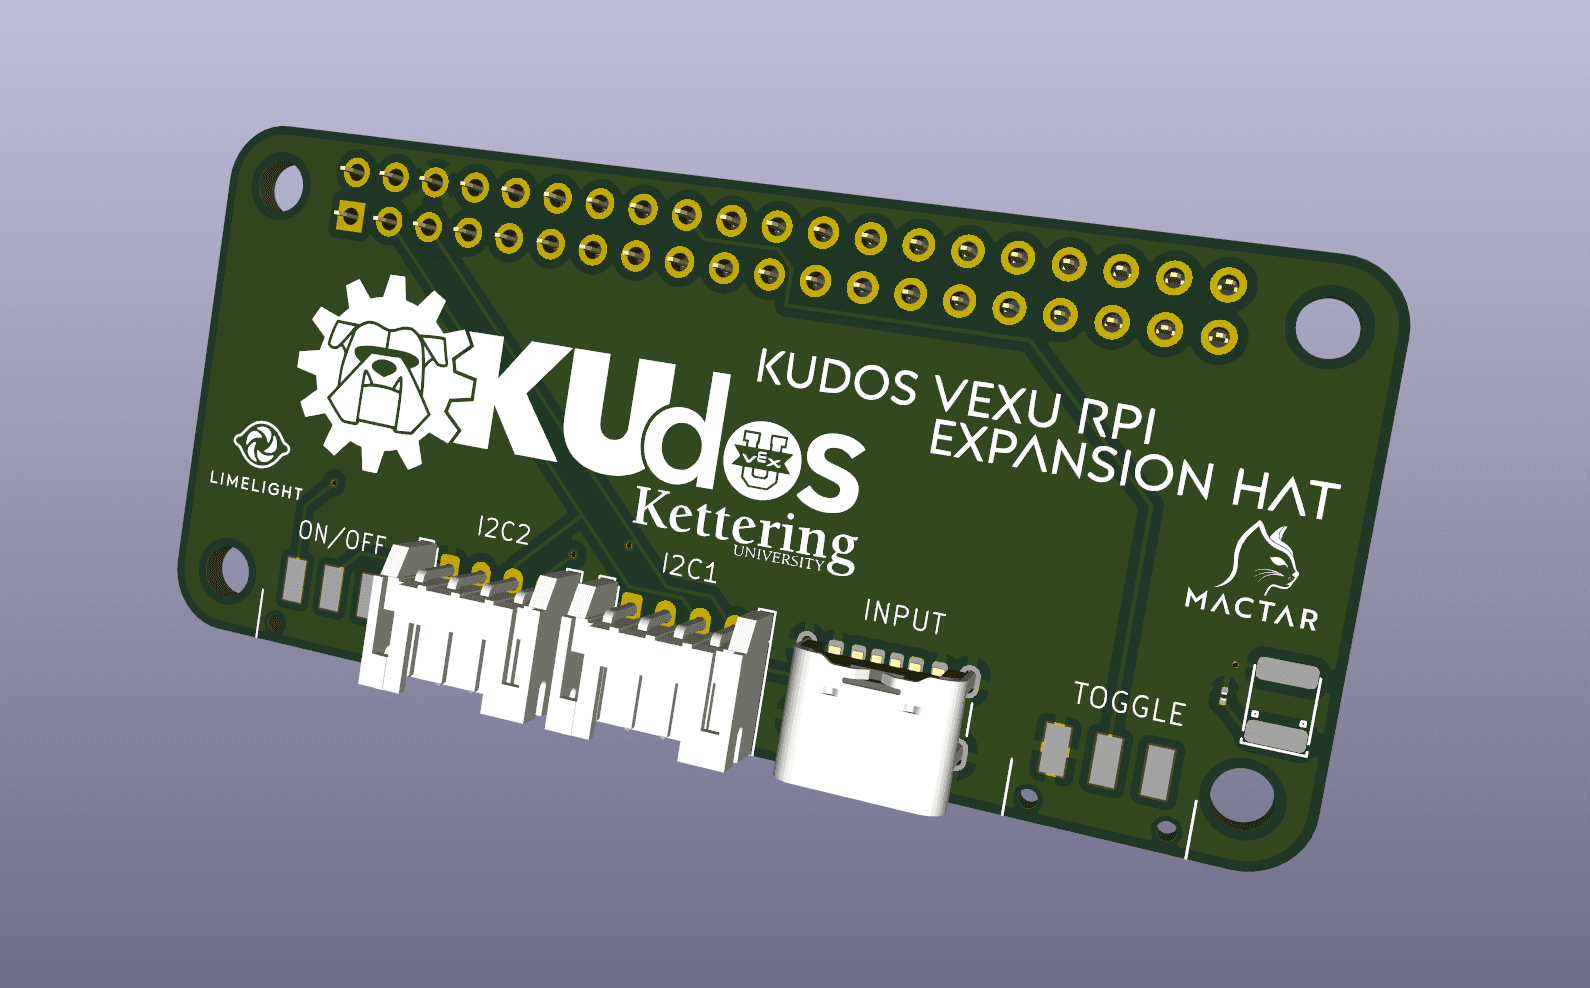
KUdos RPi Expansion HAT
A custom PCB for Raspberry Pi Zero 2W providing I2C interfacing and native RS485 communication for VEX-U robotics.
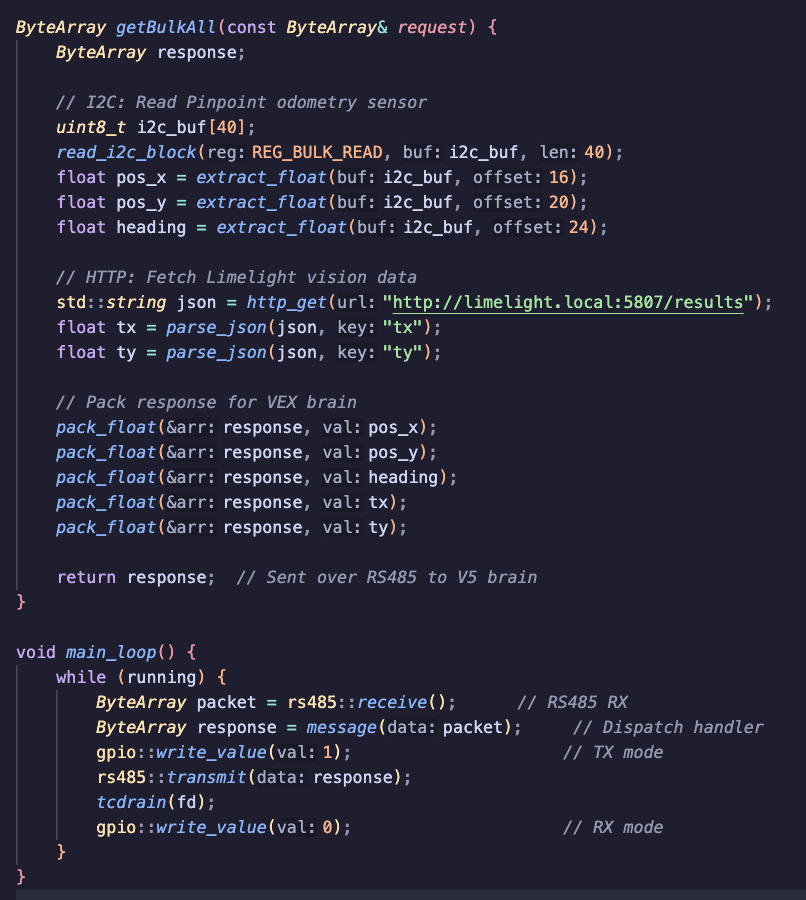
KUdos Coprocessor Firmware
The firmware running on the Raspberry Pi coprocessor for sensor fusion, vision processing, and communication with the VEX brain.
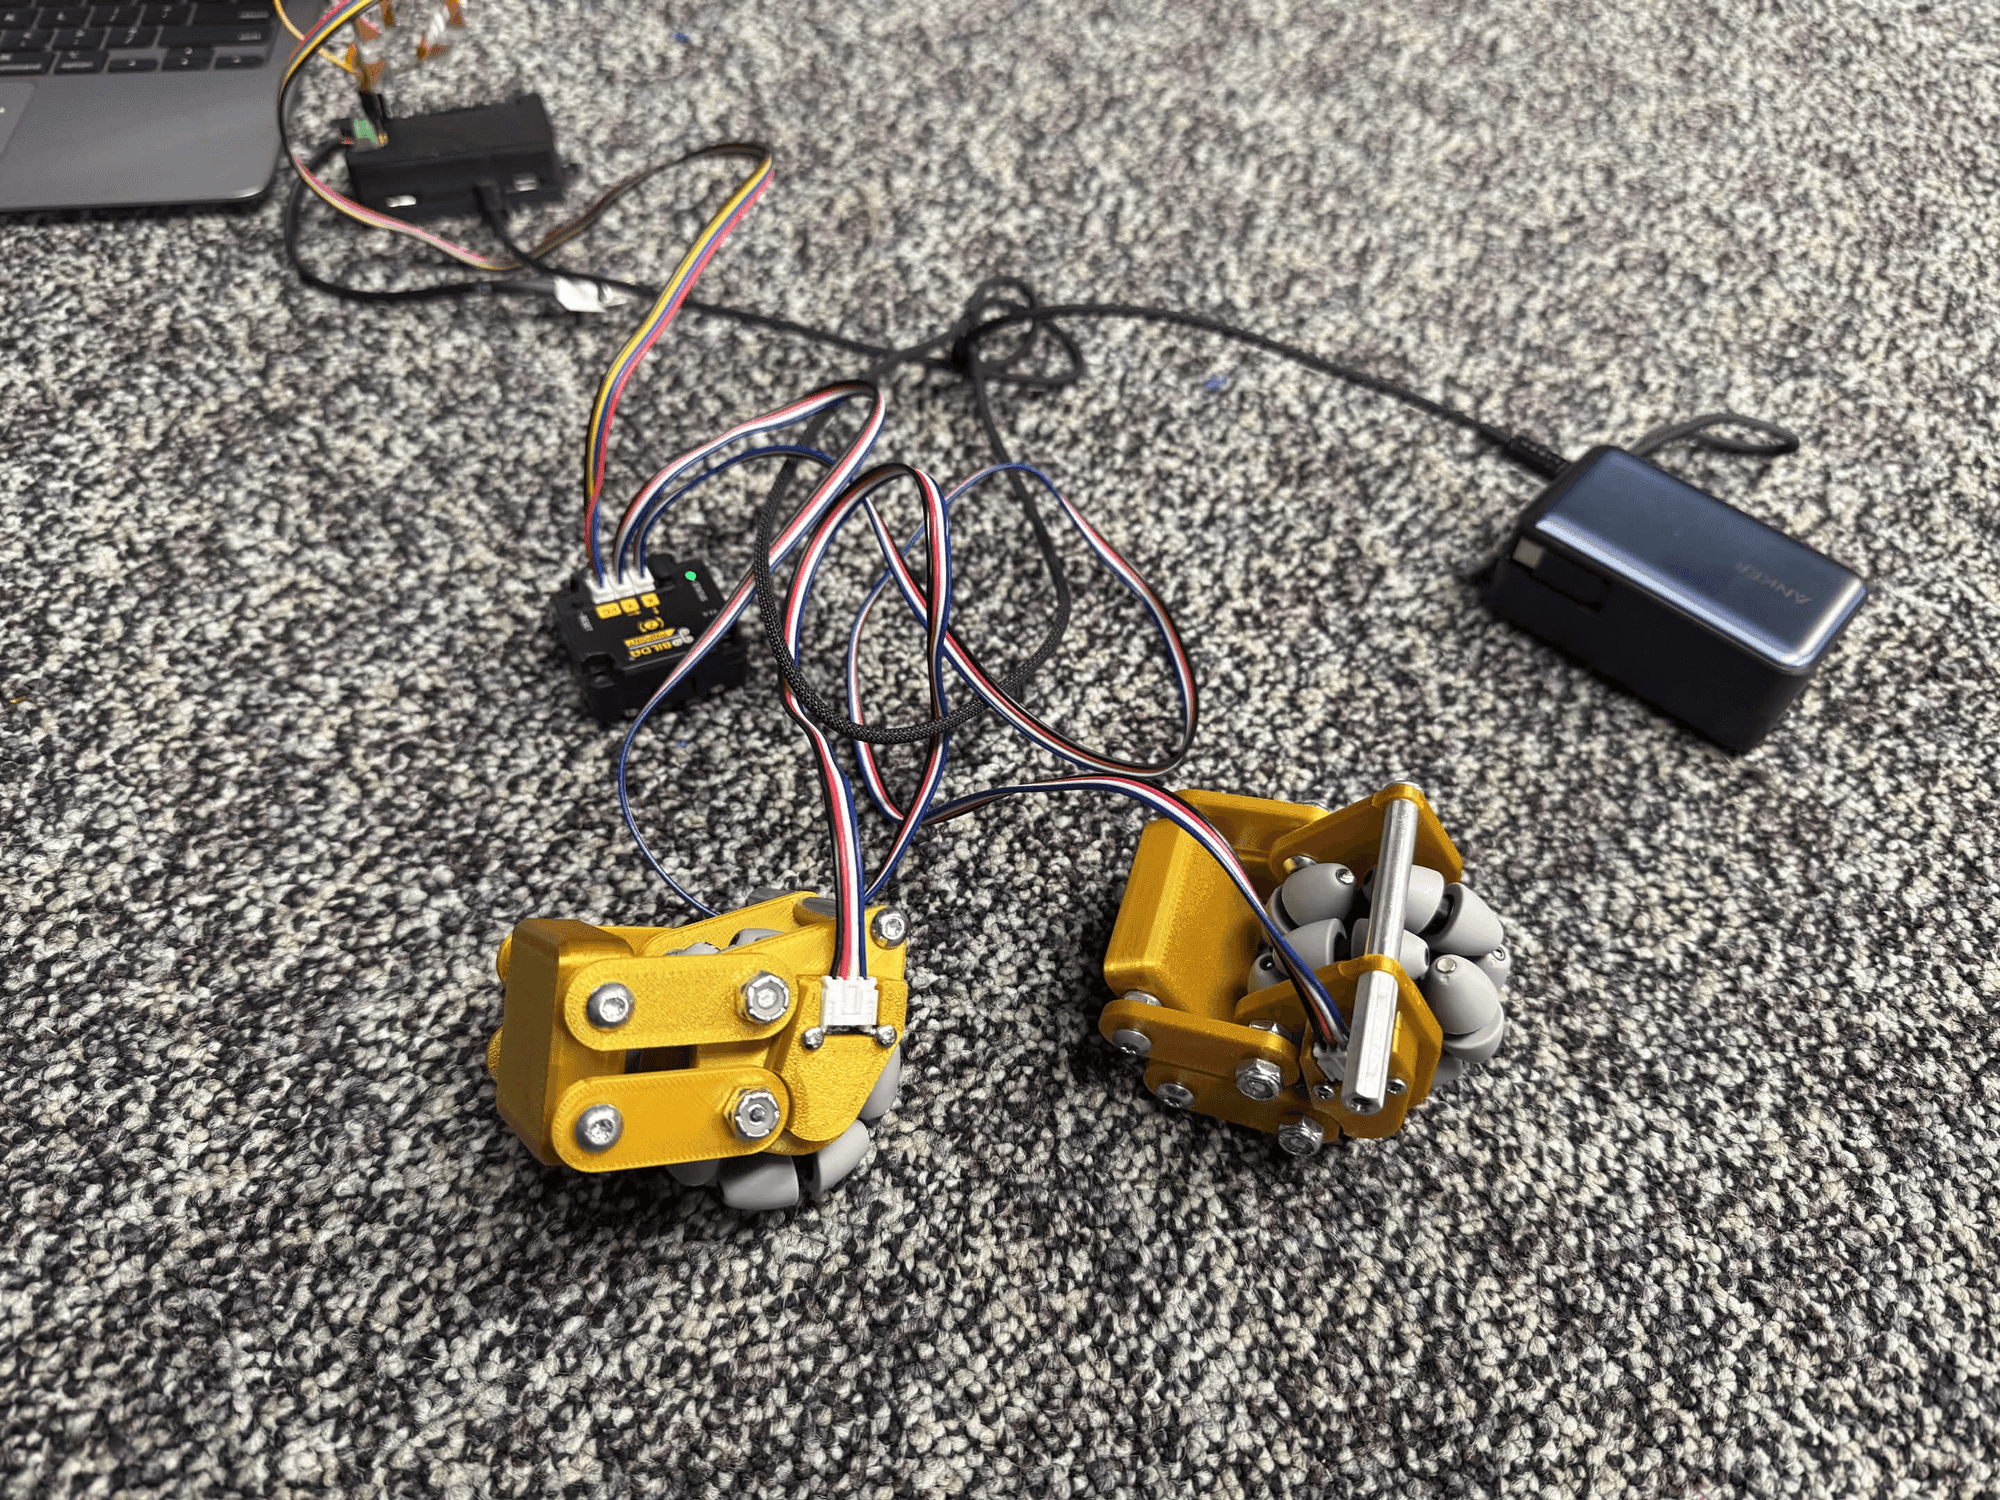
KUdos Electronics Bringup
The real-world integration and testing of the custom electronics stack on competition robots.
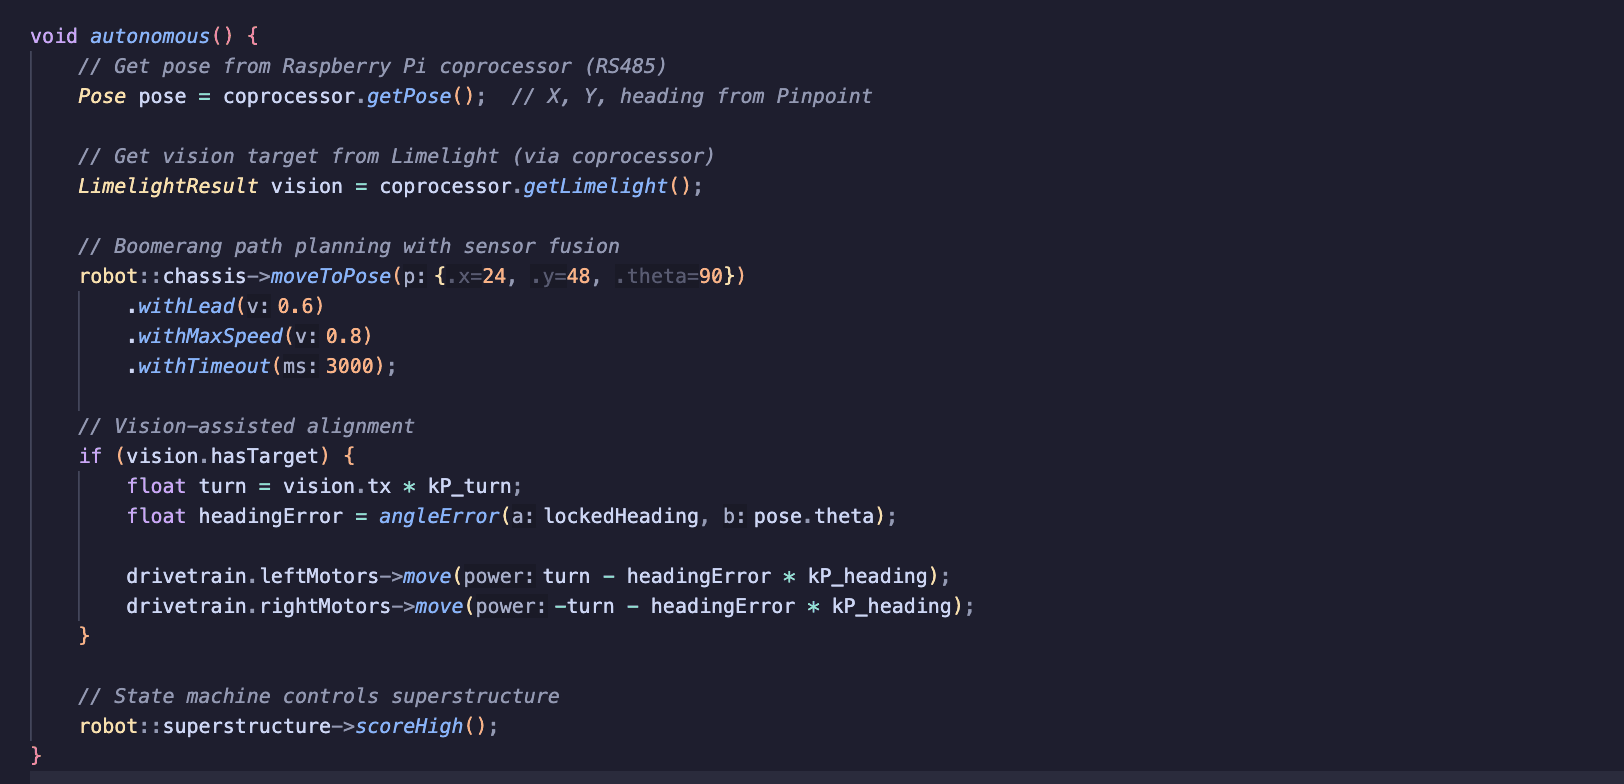
KUdos 2025-2026 Robot Code
The competition robot code for KUdos VEX-U, implementing autonomous routines and driver control with custom chassis systems.
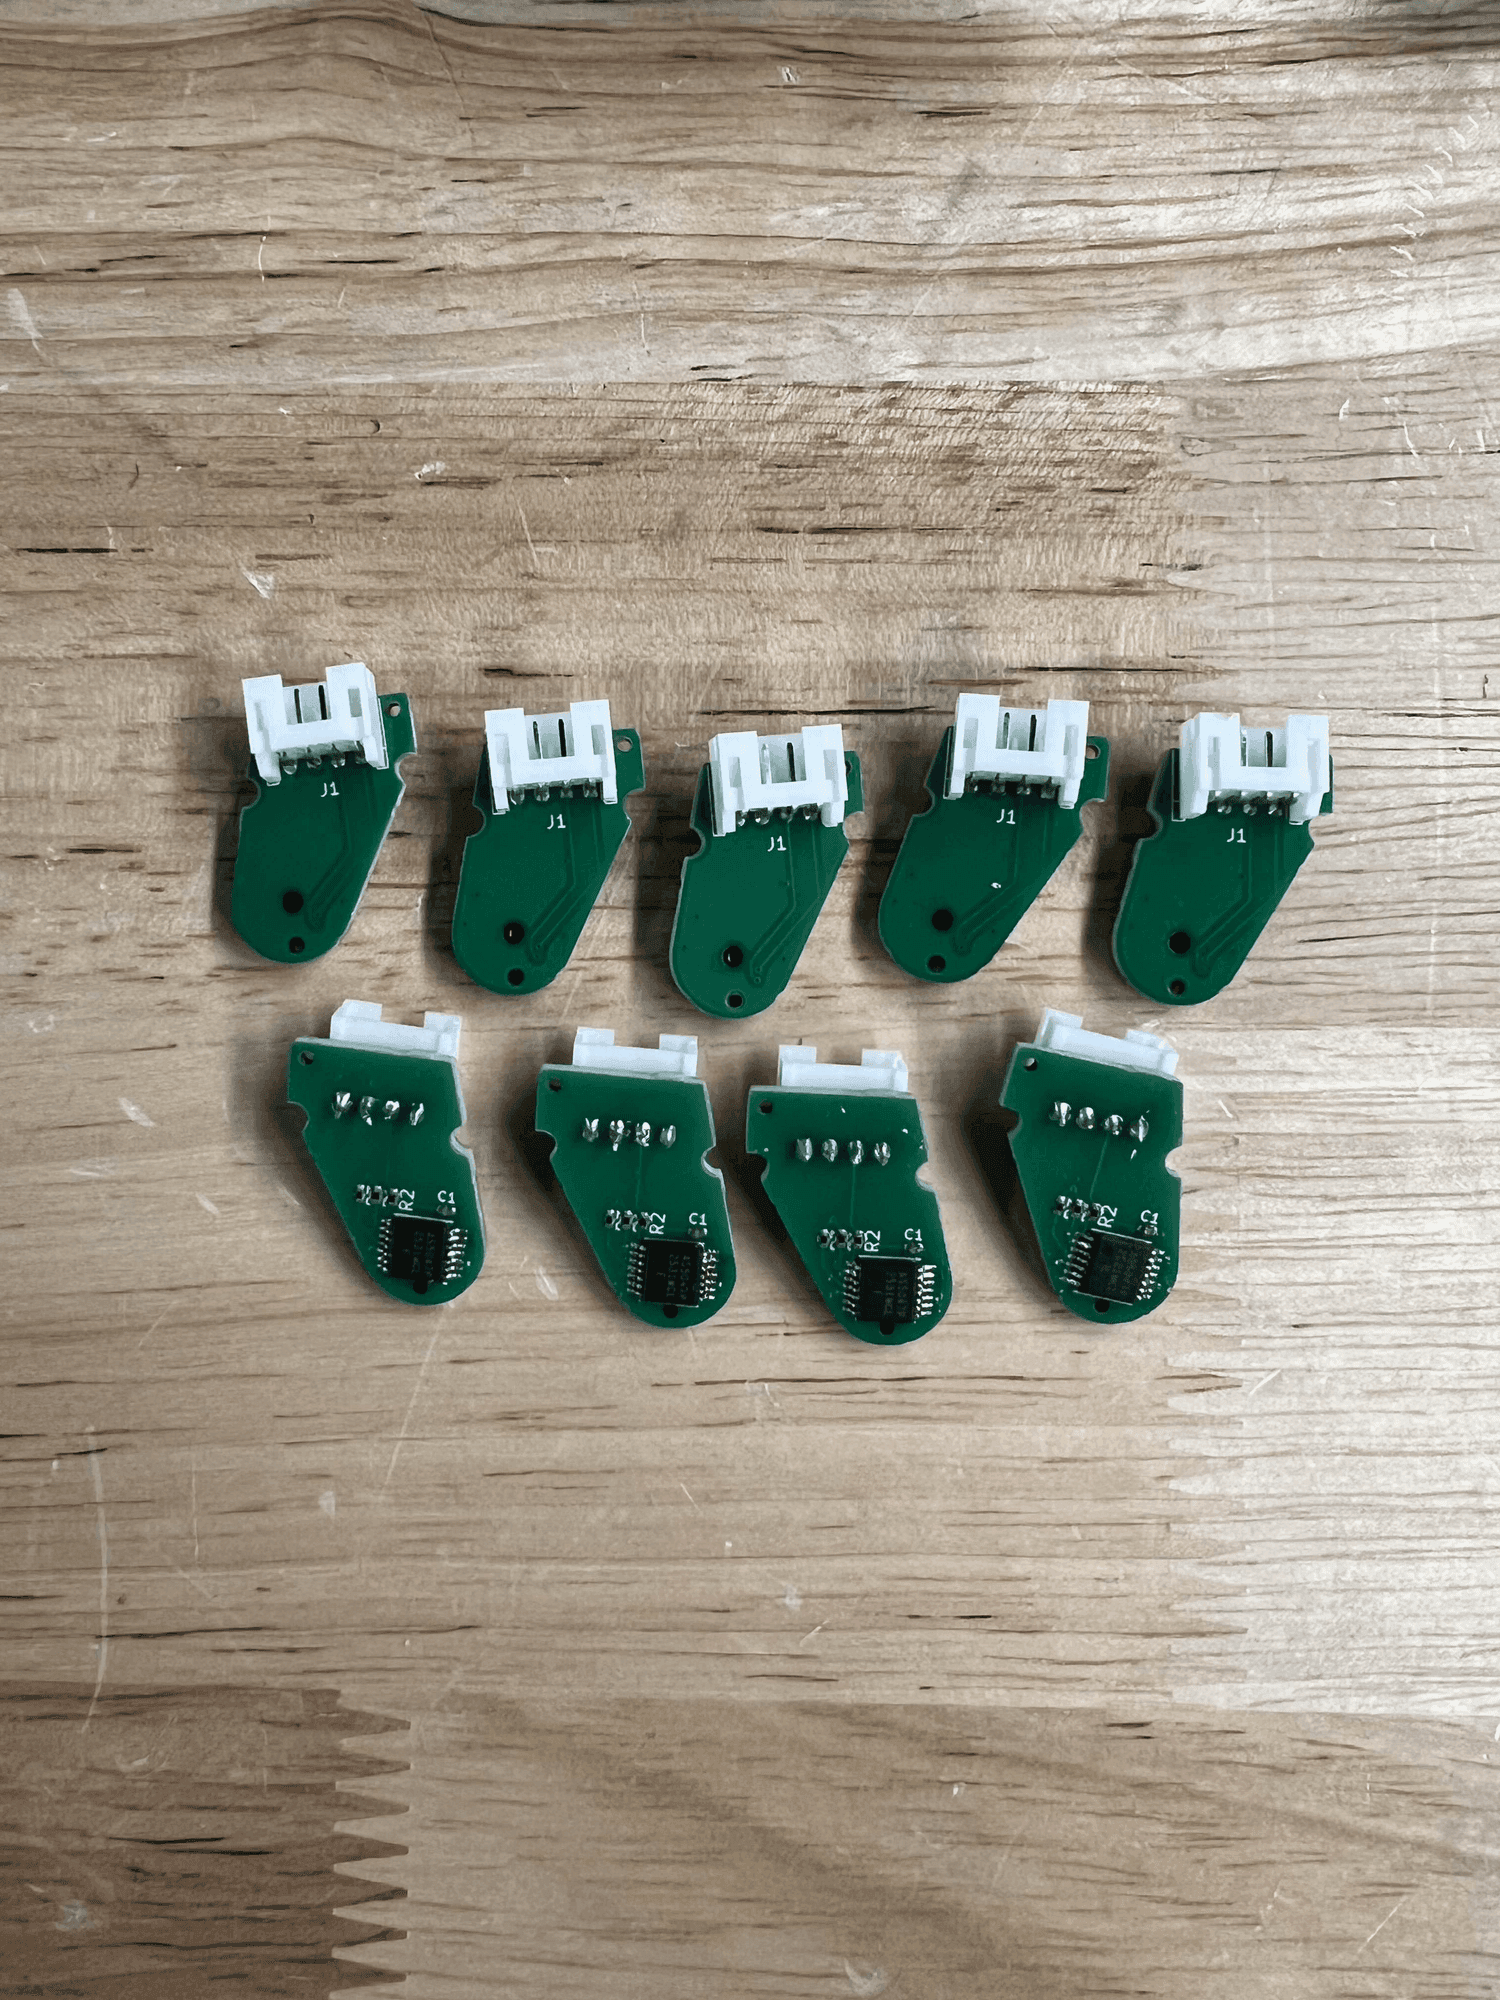
KUdos Magnetic Encoder
A custom quadrature magnetic encoder PCB using the AS5047P for high-resolution odometry on VEX-U robots.